SENSITIVITY STUDIES ON VAPOR CANOPY TEMPERATURE PROFILES
Larry Vardiman and Karen Bousselot *
ICR Graduate School, 10946 Woodside Ave. N., Santee, CA 92071
Voice: (619) 448-0900 Fax: (619) 448-3469
Voice: (619) 448-0900 Fax: (619) 448-3469
Presented at the Fourth International Conference on Creationism
Pittsburgh, PA, August 3-8, 1998
Copyright 1998 by Creation Science Fellowship, Inc.
Pittsburgh, PA USA - All Rights Reserved
Pittsburgh, PA, August 3-8, 1998
Copyright 1998 by Creation Science Fellowship, Inc.
Pittsburgh, PA USA - All Rights Reserved
KEYWORDS
Antediluvan Vapor Canopy, Antediluvan Atmosphere, Atmosphere, Atmospheric Science, Canopy, Equilibrium Temperature Profiles, Firmament, Precipitable Water, Pre-Flood Vapor Canopy, Temperature Profiles, Vapor Canopy
ABSTRACT
Temperature profiles under a water vapor canopy were studied to determine their sensitivity to variations in factors other than water vapor content. The solar constant, albedo, solar zenith angle, cirrus cloud thickness, and cirrus cloud base height were each varied independently from about 50% to 200% of their normal values and the equilibrium vertical temperature profiles determined. A vapor canopy containing about 0.1 meters of precipitable water was assumed in all cases. Surface temperatures were affected most strongly by changes in the solar constant. A 50% reduction in the solar constant reduced the surface temperature under the canopy from 335K to 240K. Changes in albedo, solar zenith angle, and cirrus cloud thickness also produced strong effects on surface temperature. However, none of the effects were so dramatic that the concern over limitation on water content in the canopy by hot surface temperatures was eliminated. If all five parameters were to be introduced into the model simultaneously such that the surface temperature was minimized, it is estimated that the precipitable water content of the canopy could possibly be raised to as much as 2.0 meters.
INTRODUCTION
Attempts have been made by Kofahl (1977), Morton (1979), Dillow (1982), and Rush and Vardiman (1990) to model the amount of water which can be held in a water vapor canopy surrounding the earth and associated temperature profiles. It has become increasingly obvious through radiation modeling that the strong greenhouse effect produced by water vapor severely limits the amount of water than can be maintained in a canopy which is in contact with the atmosphere. For example, Rush and Vardiman (1990) found that a canopy containing enough water vapor to create 50 millibars of pressure at its base (the equivalent of about 0.5 meters of precipitable water) would produce a surface temperature of over 400K. Even a water vapor canopy containing only 0.1 meters of precipitable water would produce a surface temperature of about 335K.
Five parameters were set by Rush and Vardiman (1990) at fixed values typical of today's atmosphere in their model. The parameters and their values were:
Solar constant (rate of heating of the earth by the sun) - 2 calories/cm 2 /min
Albedo (average percent of reflected energy from the earth's surface) - 13%
Solar zenith angle (angle of the sun from the vertical) - 60%
Cirrus cloud height (height of thin cloud of ice crystals) - no cloud
Cirrus cloud thickness (vertical thickness of thin cloud of ice crystals) - no cloud
Albedo (average percent of reflected energy from the earth's surface) - 13%
Solar zenith angle (angle of the sun from the vertical) - 60%
Cirrus cloud height (height of thin cloud of ice crystals) - no cloud
Cirrus cloud thickness (vertical thickness of thin cloud of ice crystals) - no cloud
These parameters were not varied but maintained constant in all runs while the canopy base pressure varied from 0 to 1013 millibars. Rush and Vardiman (1990) reported on the results of their 50 millibar simulation in detail and summarized their results on runs of 0, 10, 125, and 1013 millibars. They concluded:
It was stated earlier in this paper that two criteria for the vapor canopy would need to be met; 1) Stability, and 2) A surface temperature suitable for habitation. The first criterion was met. For any size canopy considered, at least from radiation analyses of pure water vapor canopies, it was shown that the temperature is always high enough throughout most of the canopy, particularly at the base, to easily ensure the vapor phase. The second criterion is not as straightforward to evaluate. Radiation considerations strongly suggest surface temperatures are not suitable for the 1013, 125, and 50 millibar canopies. The canopy blanket is simply so effective that the surface temperature becomes inhospitable. This could also be true for the 10 millibar canopy, though convection considerations may alter this conclusion. Inclusion of convection in the denser canopies would not change this verdict.
It would appear that other geometrys or physical conditions must have been present before the Flood for a vapor canopy to have contained enough water to contribute significantly to the Genesis Flood. Before considering more exotic water vapor distributions such as an elevated shell of water vapor surrounding the earth not in contact with the lower atmosphere, it was thought advisable to explore the effects of varying some of the "constants" used in radiation models. This exploration will determine the sensitivity of surface temperature to variations in factors other than water vapor content. The same 10 millibar canopy model used by Rush and Vardiman (1990) will be used in this report.
The one-dimensional model used by Rush and Vardiman (1990) calculated the equilibrium vertical temperature profiles which resulted from heating by solar and infrared heating at each of 20 or more layers in a two-component atmosphere. The heating was calculated from radiance calculations using the atmospheric radiance and transmission program LOWTRAN 7 developed by the U.S. Air Force (Kneizys, 1988). Radiation only was considered in a clear sky, with no clouds and no aerosols. The two-component atmosphere was structured with an upper layer of pure water vapor resting hydrostatically on a lower layer of dry air identical to today's atmosphere. The initial vertical temperature distribution was isothermal at 170 K. The solar constant was set at 2 calories/centimeter 2 /minute, the solar zenith angle at 60? , and the surface albedo at 0.13.
SOLAR CONSTANT
The heating rate per unit area that the earth receives at today's average distance from the sun is called the solar constant. Heating of the earth is calculated by multiplying the solar constant times the area of a disk with a radius equal to the earth and perpendicular to the radiation from the sun. The solar constant is approximately 2 calories/centimeter 2 /minute. The effective equilibrium temperature of the earth without an atmosphere is found by equating the rates of short-wave heating by the sun and long-wave emission to space. It is calculated to be 250K.
The observed average temperature of the earth with an atmosphere is measured to be about 290K. The difference is due to the greenhouse effect, in which visible and near-infrared sunlight penetrates through Earth's atmosphere relatively unimpeded, but thermal emission by Earth's surface is absorbed by atmospheric constituents that have strong absorption bands in the middle infrared. When a water vapor canopy containing 0.5 meters of precipitable water was introduced above today's atmosphere, as described by Rush and Vardiman (1990), the surface temperature rose even more due to the enhanced greenhouse effect to over 400K. This temperature is above the boiling point of water, making life as we know it impossible on the earth.
While exploring the implications of the changing luminosity of the sun on earth's climate several researchers have found a discrepancy between their predictions of solar evolution and evidence for the "Ice Age." See Sagan and Mullen (1972), Ulrich (1975), and Newman and Rood (1977). Most long-age, nuclear models of solar luminosity predict that the solar constant has increased by about 40% over the conventional geologic time of 3-5 billion years. Global temperatures with today's atmospheric constituents and a 40% decrease in solar constant were calculated to be as cold as 240K. Sagan and Mullen (1972) concluded that any water is likely to have existed in solid form with such global mean temperatures.
North (1975) developed a climate model that showed if the earth were once covered completely with ice, the solar constant would have to be increased to 130% of today's value before the earth could have liquid water anywhere on its surface. This dilemma has become known as the "Young-sun paradox." If the sun was 40% cooler earlier in its history, causing the earth to be covered with ice, how is it possible for the earth to be covered with liquid water today with no evidence of full ice coverage? Either the nuclear model of the sun is wrong or the earth's gaseous composition was different in the past. I will not attempt to resolve this conflict here, but will only use this controversy to support varying the solar constant between 50% and 200% of its current value.
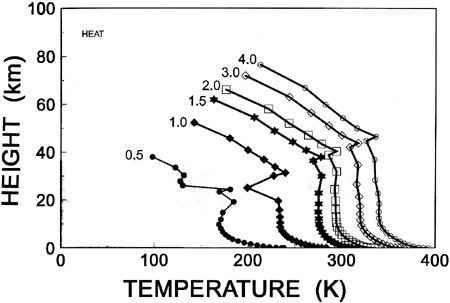
Figure 1. Equilibrium vertical temperature profiles for a 10 millibar water vapor canopy as a function of solar constant. Solar constant is shown near the top of each profile in cal/cm2/min.
Figure 1 shows the equilibrium vertical temperature profiles for a 10 millibar canopy with six different values of the solar constant. The solar constant in calories/centimeter 2 /minute is shown near the top of each profile. Each profile is the equilibrium temperature distribution using the same initial conditions as Rush and Vardiman (1990) except for the value of the solar constant. Notice that the temperature at any level is hotter for higher values of the solar constant. The discontinuity about midway up each profile occurs at the boundary between the "atmosphere" and the "canopy."
Figure 2 shows the temperature at three heights in the atmosphere as a function of the solar constant. Data for the "surface" is the temperature at the surface level for each profile. Data for "levels 1-6" is the average of the temperatures for the six lowest levels in the atmosphere including the surface level and data for "all levels" is the average of the temperature for all levels in the atmosphere. The surface temperature for a 10-millibar canopy under today's conditions is about 335K. When the solar constant is reduced by 50% to 1 calorie/centimeter 2 /minute the surface temperature decreases to 240K. If the solar constant is increased to twice that of today, the surface temperature increases to about 390K. Average temperatures for "levels 1-6" and for "all levels" respond in a similar manner.
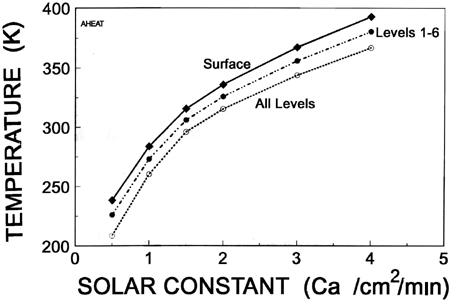
Figure 2. Temperature at three heights in the atmosphere for a 10 millibar water vapor canopy as a function of solar constant.
It is apparent that the solar constant has a significant effect on the surface temperature and other heights in the atmosphere. If the solar constant were less in the past, it would have caused a much cooler atmosphere or allowed a much thicker canopy for a similar temperature as today.
ALBEDO
The percent of solar radiation reflected from the earth relative to the amount incident upon it is called the albedo. The average albedo of the earth today including reflection from the surface and clouds is about 35%. However, the albedo varies widely as a function of cloud cover, snow cover, vegetation, and solar zenith angle. The albedo over snow and ice can be as high as 90% and as low as 5% over a forest. Deserts and areas of sparse vegetation typically have an albedo of 15-25%. Thick, widespread clouds produce an albedo of 70% or more.
The average surface albedo of the earth under today's conditions has been estimated to be about 13%. This average takes into consideration the snow cover in the polar regions, forest and other vegetation on the continents, the oceans, and average diurnal and seasonal solar zenith angles. Most climate models modify the average albedo based on more or less snow cover and vegetation. During an ice age, the surface albedo would be increased and during a tropical episode the albedo would be decreased.
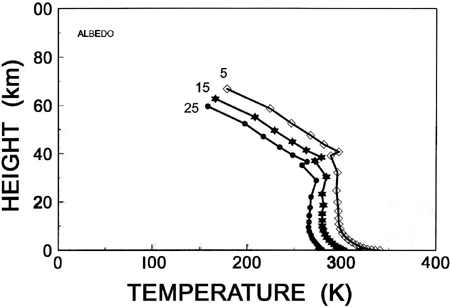
Figure 3. Equilibrium vertical temperature profile for a 10 millibar water vapor canopy as a function of surface albedo. Albedo is shown near the top of each profile in %.
Applying this reasoning to modeling of the earth following the Genesis Flood, it would seem likely that immediately after the Flood the distribution of the earth's albedo would be considerably different than today because no polar ice caps and no vegetation would have existed. The albedo would probably have changed rapidly following the Flood, however, since polar ice caps would have formed on the continents and vegetation would have regrown in the equatorial and mid-latitude regions. The global average would have been a balance between increased albedo in the polar regions and decreased albedo in the equatorial regions. It would be very interesting to explore the effect of rapidly changing albedo as a function of latitude on climate.
For this study it seemed appropriate to simply vary the earth's average global surface albedo from today's average. Surface albedo was varied from 0% (absorption of all solar radiation) to 25%. Surface temperatures would be expected to increase for low albedo and decrease for high albedo.
Figure 3 shows the equilibrium temperature profiles for a 10 millibar canopy with three different values of surface albedo. Other values were run in the model but they were of the same general shape and made the display difficult to visualize. The values of albedo are shown in percent at the top of each profile.
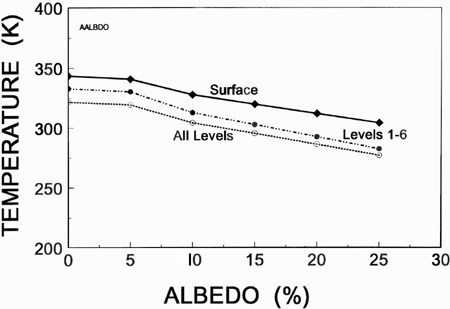
Figure 4. Temperature at three heights in the atmosphere for a 10 millibar water vapor canopy as a function of albedo.
Figure 4 shows the equilibrium temperature at three heights in the atmosphere as a function of surface albedo specified in the model. The three heights ("surface", "levels 1-6", and "all levels") are defined in the same manner as given in the discussion for the solar constant. As before, the surface values are the hottest. As expected, the equilibrium temperatures are colder for a larger albedo. This makes sense because as the albedo increases, less heat is absorbed at the surface. Since the surface serves to warm the atmosphere above, if it is colder, the atmosphere will also be colder. However, the effect is not as strong as changes in the solar constant. The surface temperature reaches a maximum value of about 345K when all of the solar radiation incident upon it is absorbed at the surface (albedo=0%) and about 305K for an albedo of 25%. It is likely that dependence of surface temperature upon albedo will be weaker for canopies with more precipitable water because less solar radiation is able to penetrate to the surface to be reflected or absorbed there. In a "thick" canopy more solar radiation is absorbed on the way down to the surface. Changes in surface albedo will therefore produce a smaller effect on the total system. The heat source for a "thick" canopy occurs at or near the top of the canopy, rather than at the surface.
SOLAR ZENITH ANGLE
The solar zenith angle is the angle of the sun from the local vertical. Rush and Vardiman (1990) set this angle at 60? for all reported runs. When the solar zenith angle is 60? the sun is 30? above the horizon and the path of the incoming radiation travels along a slant path through the atmosphere. For a solar zenith angle of 0o the distance the radiation travels through the atmosphere is minimized and the heating rate is maximized at any particular level. For a solar zenith angle of 90? the absorption path is maximized and the heating rate is minimized at any particular level. The effect is noticeable to the casual observer as a changing intensity of solar radiation between sunrise and noon at most locations on the earth.
The solar zenith angle varies diurnally and annually depending upon the latitude of the site. The range over which it varies is constrained by the obliquity of the ecliptic or "tilt" of the earth's orbit. Since the obliquity is about 23.5? the solar zenith angle at local noon varies by nearly 47? in any one place. For example, a site on the equator will have a solar zenith angle at noon of 23.5? toward the south on June 22, the summer solstice, and 23.5? toward the north on december 22, the winter solstice. Of course the solar zenith angle will be greater than 23.5? before and after noon as the sun "rises" and "sets" throughout the day. At this same site the solar zenith angle will be 0? at the vernal and autumnal equinoxes on March 21 and September 23, respectively. Maximum heating occurs at the local noon diurnally, at the summer solstice annually, and where the sun is directly overhead at noon latitudinally.
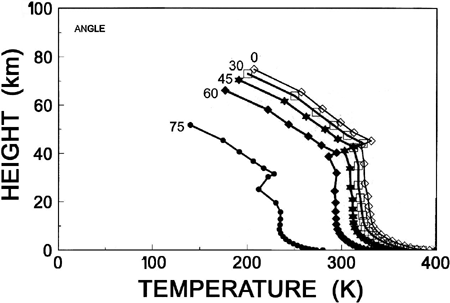
Figure 5. Equilibrium vertical temperature profiles for a 10 millibar canopy as a function of solar zenith angle. Solar zenith angle is shown near the top of each profile in degrees.
The solar zenith angle was varied in this study primarily to find the range of surface temperature as a function of latitude. Since any solar zenith angle occurs at any one time on a spherical earth, it can not be treated like a variable solar constant or albedo. Rather, we are interested in finding the heating rate which is dependent on latitude. This will allow inferences to be made about the latitudinal circulation. Greater heating near the equator will cause the atmosphere to expand and flow toward the poles aloft. Cooler temperatures near the poles will cause the atmosphere to contract and flow toward the equator near the surface of the earth. Of course, the rotation of the earth will cause complicated longitudinal circulations, but the "driving forces" of the global circulation are powered by the thermal fields established between the poles and equator by radiation.
Figure 5 shows the equilibrium temperature profiles for five different solar zenith angles between 0? and 75?. A computer run at 90? was not possible because the program became numerically unstable. The solar zenith angle is shown near the top of each temperature profile. Note that the hottest profile was for an angle of 0?, as expected when the sun is directly overhead. The surface temperature for this run exceeded 400K. For an angle of 75? when the sun is only 15? above the horizon, the atmosphere is compressed in the vertical and the surface temperature is near 273K, the freezing point of water.
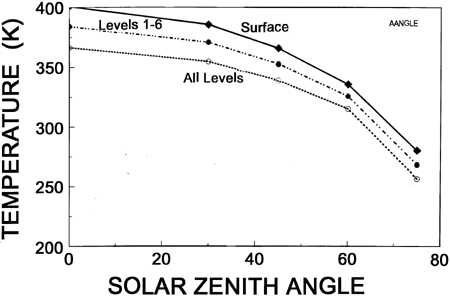
Figure 6. Temperature at three heights in the atmosphere for a 10 millibar water vapor canopy as a function of solar zenith angle.
Figure 6 shows the equilibrium temperature profiles for three heights in the atmosphere. The range of temperature between a solar zenith angle of 0? and 75? is over 100K. This range is about the same or greater than that observed in the atmosphere today without a canopy. This would imply significant potential for global circulation, in opposition to predictions made by Rush and Vardiman (1990) and others about climate under a canopy. If strong global circulations exist, it is likely that strong winds and storms would also exist. Given the strongly stable conditions found in this model, however, it isn't clear what this would mean in terms of precipitation and surface conditions. It would probably be necessary to model these conditions with a three dimensional general circulation model before more conclusions should be drawn.
CLOUD THICKNESS AND CLOUD BASE HEIGHT
In all the computer simulations by Rush and Vardiman (1990) the water vapor canopy and atmosphere were assumed to contain no clouds. This assumption seemed to fit the Biblical conditions and were consistent with the stable environment found in the model. This resulted in little or no precipitation, which also satisfied Biblical constraints. In particular, the canopy exhibited a thermal vapor pressure distribution which exceeded the hydrostatic pressure at all levels except near the very top of the canopy at temperatures below 273K. Since few levels near the top exhibited this characteristic and any ice crystals formed would evaporate as they fell to lower levels in the canopy, Rush and Vardiman (1990) explored only radiation in a clear canopy and atmosphere and recommended cloudy conditions be considered in future research. That recommendation has now been pursued and will be reported on here.
The role of clouds in the global radiative process has become recognized and more understood in the past few years. One of the landmark papers on this topic was that of Ramanathan et al. (1989). Some of the basic conclusions of this paper were:
Clouds are regulators of the radiative heating of the planet. They reflect a large part of the incoming solar radiation, causing the albedo of the entire earth to be about twice what it would be in the absence of clouds (Cess, 1976; Ellis, 1978; Schneider, 1972). Clouds also absorb the longwave (LW) radiation (also known as infrared or thermal radiation) emitted by the warmer earth and emit energy to space at the colder temperatures of the cloud tops. Cloud LW absorption and emission are, in a sense, similar to the radiative effects of atmospheric gases. The combined effect of LW absorption and emission -- that is, the greenhouse effect -- is a reduction in the LW radiation emitted to space. The greenhouse effect of clouds may be larger than that resulting from a hundredfold increase in the CO2 concentration of the atmosphere (Cess, 1976; Ellis, 1978).
The question which needs to be addressed in this vapor canopy study is, Would the addition of clouds in the canopy lead to cooler temperatures, helping relieve the temperature problem at the surface? The earlier simulations by Rush and Vardiman (1990) showed the presence of supersaturated conditions at the top of the canopy at temperatures below freezing. This implies that cirrus clouds would form high in the canopy possibly altering the albedo and emission properties of the canopy/atmosphere system.
Fortunately, the LOWTRAN radiation code used by Rush and Vardiman (1990) had the capability of configuring various types of clouds at different levels in the atmosphere. The NOAA Cirrus Model (Hall et al., 1983) was selected to characterize the optical properties of the cloud in the canopy.
The NOAA model has the following form for normal transmittance though cirrus:
|
t = exp (0.14L2)
|
[1] |
where t is the transmittance and L is the cloud thickness in kilometers. The model allowed cloud thickness and cloud base height to be specified.
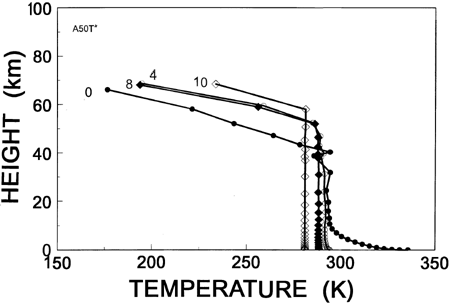
Figure 7. Equilibrium vertical temperature profiles for a 10 millibar canopy as a function of cirrus could thickness in kilometers at a cloud base height of 50 kilometers.
Figure 7 shows the equilibrium temperature profiles as a function of cirrus cloud thickness for a cloud base height of 50 kilometers. The cloud thickness is shown in kilometers near the top of each profile. The profile for 0 kilometers is the same profile found by Rush and Vardiman (1990) for a 10 millibar canopy with no cloud. Notice that the surface temperature cools dramatically as the cirrus cloud layer thickens from 0 kilometers to 10 kilometers. At 10 kilometers thickness the surface temperature has cooled by about 60K and most of the temperature profile is isothermal from the cloud layer to the surface. As the cloud layer thickens it becomes opaque to the solar radiation and the cloud layer becomes the heating source for the atmosphere and surface below, rather than the surface of the earth. Because the longwave radiation is trapped between two layers in equilibrium, the cloud and the earth's surface reach equilibrium and the temperature in between becomes isothermal.
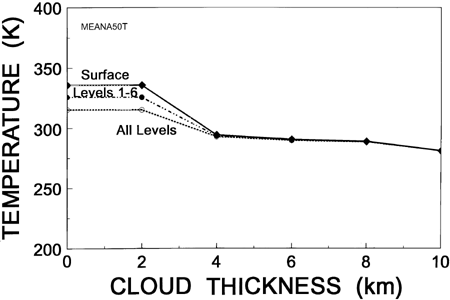
Figure 8. Temperature at three heights in the atmosphere for a 10 millibar water vapor canopy as a function of cloud thickness.
Figure 8 shows the equilibrium temperatures for the three heights in the atmosphere as a function of cloud thickness. Notice that all three heights are the same temperature for a thickness greater than 4 kilometers, meaning that all profiles are isothermal under the canopy for thicknesses greater than 4 kilometers. Between 0 and 2 kilometers no effect of the cirrus cloud layer is discernible, but between 2 and 4 kilometers thickness the cirrus cloud eventually blocks all shortwave radiation to the ground. The isothermal layer from the cirrus cloud to the surface is about 280K for a cloud thickness of 10 kilometers. This would be a very strange world -- uniformly cold at a temperature slightly above freezing, extremely stable, and dark, with little or no visible light.
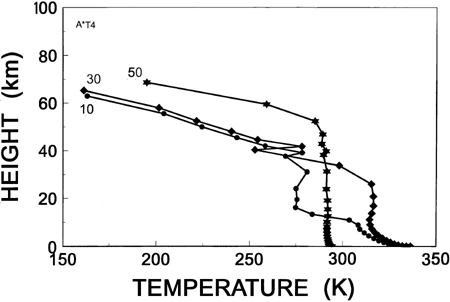
Figure 9. Equilibrium vertical temperature profiles for a 10 millibar water vapor canopy as a function of cloud base height. The cloud base height is shown near the top of each profile in kilometers.
Figure 9 shows the equilibrium temperature profiles as a function of cloud base height for a cloud thickness of 4 kilometers. The cloud base height is shown in kilometers near the top of each profile. Notice that as the cloud base height decreases from 50 kilometers the upper part of the temperature profile above the cloud layer approaches the same shape as the temperature profile for no cloud layer shown in Fig. 7. The isothermal layer still forms below the cloud layer for a short distance, but near the surface the temperatures are warmer again similar to the profile without a cirrus cloud layer. The transitions from one condition to another when the cloud layer is close to the surface should be explored further to isolate the effects causing the complex patterns.
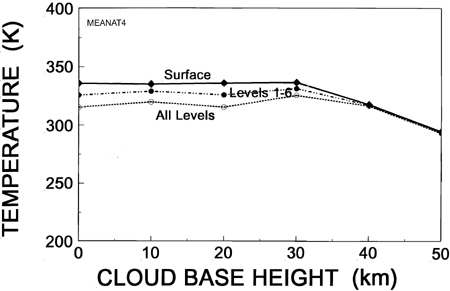
Figure 10. Figure 10 Temperature at three heights in the atmosphere for a 10 millibar water vapor canopy as a function of cloud base height.
Figure 10 shows the equilibrium temperatures for the three heights in the atmosphere as a function of cloud base height. The temperatures of all three heights have little dependence on cloud base height until about 30 kilometers. Above 30 kilometers the temperatures of the three levels converge to the same cooler value of about 300K because of the thick isothermal layer which forms.
CONCLUSIONS
Surface temperatures were most strongly affected by changes in the solar constant. A 50% reduction in the solar constant reduced the surface temperature under the canopy from 335K to 240K. The albedo, solar zenith angle, and cirrus cloud thickness also produced strong effects on surface temperature. However, none of the effects was so dramatic that the concern over limitations on water content in the canopy by hot surface temperatures was eliminated. If all five parameters were introduced into the model simultaneously such that the surface temperature was minimized, it is estimated that the water content of the canopy could possibly be raised to as much as 1.0 meter. This is less than 10% of the water content suggested by Dillow (1982). Unfortunately, this amount of water in a canopy would not contribute significantly to the waters of the Genesis Flood or produce significant pressure and density effects. However, it would produce large differences in temperature, atmospheric stability, cloud formation, and precipitation from that experienced today.
Although this result is disappointing for advocates of a vapor canopy, the story may not yet be complete. It is possible that the high albedo produced at the top of a cloud layer in the canopy may reduce the flux of radiation into the canopy and atmosphere greatly reducing the heating. This effect was not included in the simulations of this paper. The albedo changes modeled were only due to those effects at the surface of the earth.
RECOMMENDATIONS
It is recommended that a simulation be conducted where all five "constants" are held at the values where the surface temperature is minimized simultaneously and the albedo effect at the top of clouds in the canopy be included to determine the maximum amount of water vapor the canopy can hold.
It is also recommended that the complex relationship between cloud thickness, cloud base height, and vertical temperature profiles be explored further. Three dimensional global circulation models should be used to simulate the affect of varying the albedo and solar zenith angle under the canopy. They are designed to compute the global circulation caused by varying three dimensional patterns of albedo and solar geometry.
If these efforts fail to permit a sizeable quantity of water to be maintained in the canopy, then consideration should be given to exploring canopies in orbits above the atmosphere where thermodynamic considerations do not constrain the quantity of water.
ACKNOWLEDGMENTS
Funding for Karen Bousselot to conduct these sensitivity studies was provided by Mr. and Mrs. James Moyers with matching gifts by the Mobil Oil Corporation. The computers used in these studies were provided by Mr. Steve Low and associates with matching gifts by the Hewlett-Packard Corporation.
REFERENCES
- Cess, R.D., Climate Change: An Appraisal of Atmospheric Feedback Mechanisms Employing Zonal Climatology. Journal of the Atmospheric Sciences, Vol. 33, No. 10, (1976) 1831-1843.
- Dillow, J.C., The Waters Above: Earth's Pre-Flood Vapor Canopy. Revised edition, 1982, Moody Press, Chicago.
- Ellis, J.S., Cloudiness, the Planetary Radiation Budget, and Climate . Ph.D. Thesis, 1978, Colorado State University, Ft. Collins, Colorado. Available through University Microfilms.
- Hall, Jr. F.F., M.J. Post, R.A. Richter, G.M. Lerfald, and V.E. Derr, Cirrus Cloud Model, In Atmospheric Transmittance/Radiance: Computer code LOWTRAN 6 , by F.X. Kneizys, E.P. Shettle, W.O. Gallery, J.H. Chetwynd, Jr., L.W. Abreu, J.E.A. Selby, S.A. Clough, and R.W. Fenn, 1983, Air Force Geophysics Laboratory, Environmental Research Papers, No. 846, AFGL-TR-83-0187.
- Kneizys, F.X., E.P. Shettle, L.W. Abreu, J.H. Chetwynd, R.W. Fenn, W.O. Gallery, J.E.A. Selby, and S.. Clough, Atmospheric Transmittance/Radiance: Computer Code Lowtran 6, (1988), AFGL-TR-83-0187, Air Force Geophysics Laboratory, Hanscom AFB, Massachusetts.
- Kofahl, R.E., Could the Flood Waters Have Come from a Canopy or Extraterrestrial source? Creation Research Society Quarterly, 1977, 13:202.
- Morton, G.R., Can the canopy hold water? Creation Research Society Quarterly, 16: (1979) 164.
- Newman, M.J. and R.T. Rood, Implications of Solar Evolution for the Earth's Early Atmosphere. Science, 198: (1977)1035-1037.
- North, G.R., Analytical Solution to a Simple Climate Model with Diffusive Heat Transport, Journal of the Atmospheric Sciences, Vol. 32, No. 7, (1975) 1301-1307.
- Ramanathan, V, R.D. Cess, E.F. Harrison, P. Minnis, B.R. Barkstrom, E. Ahmad, D. Hartmann, Cloud-radiative Forcing and Climate: Results from the Earth Radiation Budget Experiment, Science 243: (1989) 57-63.
- Rush, D.E. and L. Vardiman, Pre-Flood Vapor Canopy Radiative Temperature Profiles. Proceedings of the Second International Conference on Creationism, R.E. Walsh, et al., Editors, 1990, Creation Science Fellowship, Pittsburgh, PA, 231-245.
- Sagan, C. and G. Mullen, Earth and Mars: Evolution of Atmospheres and Surface Temperature. Science, 177: (1972) 52-56.
- Schneider, S., Cloudiness as a Global Climatic Feedback Mechanism: The Effects on the Radiation Balance and Surface Temperature of Variations in Cloudiness. Journal of the Atmospheric Sciences, Vol. 29, No. 8, (1972)1413-1422.
- Ulrich, R.K., Solar Neutrinos and Variations in the Solar Luminosity. Science, 190: (1975) 619-624.


