Recent reports of ice-core drilling in Greenland have raised anew the question for young-earth creationists…How could so much ice accumulate in polar regions in only a few thousand years? Corings through the ice in central Greenland have reached depths of almost two miles, and ice at the bottom has been estimated to be as old as 250 thousand years.[1][2]
In a previous Impact article, [3] I suggested that thick ice sheets could be explained if high precipitation rates occurred immediately following the Flood. The "annual" layers of ice near the bottom of the ice sheet should be thicker than that expected by the uniformitarian model and contain unusual excursions of ð18O, acidity, and particulates. I further suggested that the "annual" layers deep in the Greenland ice sheet may be related to individual storms rather than seasonal accumulation.
Since my earlier article, two major advances in creationist research have led to greater confidence in the young-earth model of ice-sheet formation. First, the suggestion by Oard[4] that the oceans may have been warmer at the end of the Flood seems to have been strengthened by an analysis of sea-floor sediment data. Second, numerical modeling studies at the Institute for Creation Research show that warmer oceans would produce very high precipitation rates in polar regions in patterns required for the formation of ice sheets.
Evidence for warm oceans in the past, cooling to the temperatures observed today, has been found in the chemical analysis of sea-floor sediments. Corings of sea-floor sediments have been made at almost 1000 sites on the bottom of the oceans, from the equator to the poles. Analysis of the ratio of the concentration of 18O to 16O in the skeletal remains of various ocean organisms in sea-floor sediments has allowed estimates to be made of the temperature of the ocean in the past. If a particular organism lived near the upper surface of the ocean, the measurement of its ratio allows an estimate to be made of the surface temperature during its lifetime. If a particular organism lived on the bottom, the ratio estimates the bottom temperature.

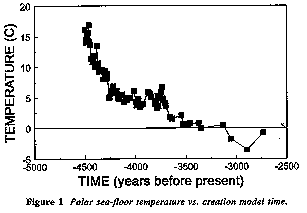
Figure 1 shows estimated temperature as a function of time for polar-bottom water, derived from the 18O/16O ratio of benthic foraminifera. Benthic foraminifera are marine microorganisms which live on the ocean bottom and deposit calcium shells on the ocean floor when they die. The time scale is shown according to the Ussher Chronology, in which the Flood is calculated to have occurred about 4,500 years ago. A major assumption in constructing this plot from the original data[5][6] was the location of the appropriate level in the sea-floor sediment for the end of the Genesis Flood. It has been assumed that the Flood ended at the interface between the Cretaceous and Tertiary periods. According to the long-age, evolutionary time model, this so-called K/T boundary occurred about 65 million years ago.
The standard long-age view holds that the oceans were warmer than 20° C some 65 million years ago and have cooled slowly since then to the temperatures we observe today. According to this view the dinosaurs and other prehistoric creatures lived in a much warmer climate. As the oceans cooled, a series of "Ice Ages" occurred, modulated by the orbital cycles of the earth's orbit around the sun. We are currently in an interglacial period, according to this model.
The young-earth, creationist view suggested by Figure 1 is that the oceans were warmer at the end of the Flood and cooled over the past 4,500 years to the temperature we observe today. Only one "Ice Age" has occurred and was, in fact, caused by the residual heat in the oceans left over from the Flood. The compression of the data from some 65 million years to only 4,500 years results in a plot which has the appearance of a standard Kelvin cooling curve, i.e., rapid cooling at first when the temperature gradient is the greatest, to slower cooling later when the gradient is less.
High Precipitation Rates in Polar Regions
In an attempt to show that warm ocean temperatures will result in heavy precipitation rates in polar regions a numerical simulation of the atmosphere was conducted on the Community Climate Model developed at the National Center for Atmospheric Research. The model, which had previously only been run on a mainframe computer like the CRAY-YMP, was adapted to a 486 personal computer and validated with a standard simulation run for a perpetual January condition in today's atmosphere. The standard simulation run was found to match today's atmospheric conditions well.

Uniform 30° C sea-surface temperatures were then entered into the model, oceanic ice shelves removed, and the model started again with all other initial conditions the same. A short simulation run was completed. The conditions seem to force the model so strongly that equilibrium appears to have been achieved rapidly. However, the model will continue to be run in order to be certain. The model behaved significantly differently for the warm ocean than for today's conditions.
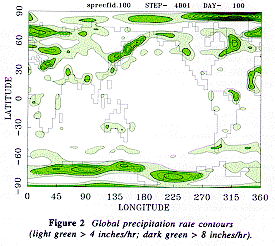
Figure 2 shows the precipitation rates over the entire globe for 100 days of simulated time, assuming seasoned conditions remain uniform. The precipitation rates are extreme in the polar regions and along the continental boundaries of the northern hemisphere. Rates exceed 8 inches/hr over Greenland, Antarctica, southeastern Asia, northeastern North America, northwestern Europe, and western Africa. The center of Asia and North America appear relatively dry. Of special interest is the relatively dry region from the eastern end of the Mediterranean eastward across the continent of Asia. This pattern may have been of particular value to Noah and his descendants as they left the Ark on Mt. Ararat and emigrated south and east.
The estimates of paleotemperatures from benthic foraminifera seem to strengthen the suggestion by Oard[4] that the oceans were originally warm at the end of the Flood and gradually cooled to the temperature observed today. Although this result is encouraging, more indicators of oceanic temperature change should be explored.
The numerical simulation of a global climate with warm oceans produces high precipitation rates in polar regions and along continental boundaries. High precipitation rates in these locations would probably have produced the necessary conditions for the rapid formation of ice sheets in Greenland, Antarctica, and North America. Numerous additional computer simulations and comparisons with historic data should be conducted to ensure that these findings are valid.
These two results, if confirmed, will go a long way toward bolstering the creationist model of the "Ice Age." The ice in the polar regions can then be considered a residual effect of the Flood, which was a judgment by God on the earth for the sins of man. Out of whose womb came the ice? It can be attributed to God, not to some impersonal natural process which occurred by chance over millions of years.
The Climate and Global Dynamics Division of the National Center for Atmospheric Research is gratefully acknowledged for providing a copy of the Community Climate Model used in this study. Mr. Steve Low and his colleagues at Hewlett- Packard donated the personal computer. Mr. Herman Daily donated his time and expertise to modify the model, designed to run on a CRAY.
[1] Alley, R.B., D.A. Meese, C.A. Shuman, A.J. Gow, K.C. Taylor, P.M. Grootes, J.W.C.White, M. Ram, E.D. Waddington, P.A. Mayewski, and G.A. Zielinski, 1993. "Abrupt Increase in Greenland Snow Accumulation at the End of the Younger Dryas Event," Nature, 362, 527-529.
[2] Dansgaard, W., S.J. Johnsen, H.B. Clausen, D. Dahl-Jensen, N.S. Gundestrup, C.U. Hammer, C.S. Hvidberg, J.P. Steffensen, A.E. Sveinbjomsdottir, J. Jouzel, and G. Bond, 1993. "Evidence for General Instability of Past Climate from a 250-Kyr Ice-Core Record," Nature, 364, 218-220.
[3] Vardiman, L., 1992. "Ice Cores and the Age of the Earth," ICR Impact article, No. 226, Institute for Creation Research, San Diego, CA, April.
[4] Oard, M.J., 1990. An Ice Age Caused by the Genesis Flood, ICR monograph, Institute for Creation Research, San Diego, CA, 243 pp.
[5] Kennett, J.P., R.E. Houtz, P.B. Andrews, A.R. Edwards, V.A. Gostin, M. Hajos, M. Hampton, D.G. Jenkins, S.V. Margolis, A.T. Ovenshine, and K. Perch-Nielson, 1975. "Site 284," in Initial Reports of the Deep Sea Drilling Project, J.P. Kennett, and R.E. Houtz, et al., editors, 29, 403-455.
[6] Shackleton, J.J., and Kennett, J.P., 1975. "Paleotemperature History of the Cenozoic and the Initiation of Antarctic Glaciation: Oxygen and Carbon Isotope Analysis in DSDP Sites 277, 279, and 281," in Initial Reports of the Deep Sea Drilling Project, J.P. Kennett, and R.E. Houtz, et al., editors, 29, 743-755.
* Job 38:29
** At the time of publication, Dr. Vardiman was Chairman of the Physics Department and Administrative Vice President of ICR.
Cite this article: Vardiman, L. 1994. Out of Whose Womb Came the Ice? Acts & Facts. 23 (8).


